Start with the learning question
A batch average can look healthy while a minority of students struggle with a particular chapter or question format.
A batch average can look healthy while a minority of students struggle with a particular chapter or question format.
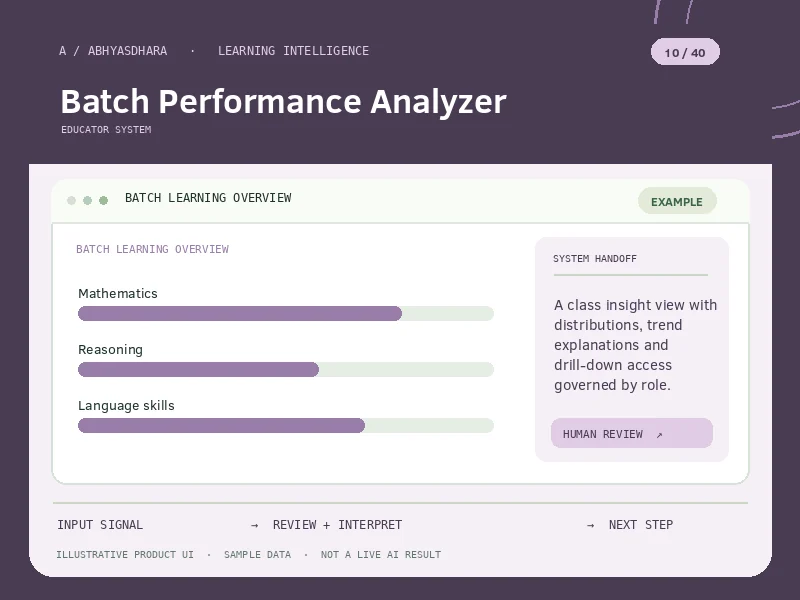
Compares learning patterns by class, batch, subject and chapter.
Aggregate by subject and topic, compare distributions over time and identify where instruction or practice might need adaptation.
Explore all 40 feature visuals →A batch average can look healthy while a minority of students struggle with a particular chapter or question format.
Aggregate by subject and topic, compare distributions over time and identify where instruction or practice might need adaptation.
A class insight view with distributions, trend explanations and drill-down access governed by role.
Review the sequence from input to reviewable output.
A batch average can look healthy while a minority of students struggle with a particular chapter or question format.
Consent-appropriate class membership, approved assessment data, topics, chapters and time periods.
Aggregate by subject and topic, compare distributions over time and identify where instruction or practice might need adaptation.
A class insight view with distributions, trend explanations and drill-down access governed by role.
Example only. This is not live customer data or an AI-generated result.
Overall maths scores improve, but a cluster of students repeatedly misses time-and-work conversion questions.
Small group statistics can expose individuals. Guard access, suppress unnecessarily identifying slices and avoid unsupported causal claims.
Small group statistics can expose individuals. Guard access, suppress unnecessarily identifying slices and avoid unsupported causal claims.
Illustrations are not live AI output or evidence of tested accuracy.